In our previous posts, we tracked the entire lifecycle of a feature, from its birth as a product constraint in the Requirements app, to its story-pointing session in the Estimations app, and finally to its development sprint on the Delivery board.
Now, how do you know if all that effort is actually moving the needle? How do you calculate your team’s velocity, monitor bottlenecks, and prove efficiency without forcing developers to fill out tedious manual timesheets?
Welcome to the final command deck: the Divblox Project Health App.
Zero Configuration: Power from Day One
The best analytics tools are the ones you don’t have to build. The Project Health app requires absolutely no additional setup. The moment you sign up for Divblox and your team starts moving tickets across the Delivery board, Project Health begins operating in the background. It automatically aggregates data across your workspace to serve up real-time, actionable insights.
Precision Filtering
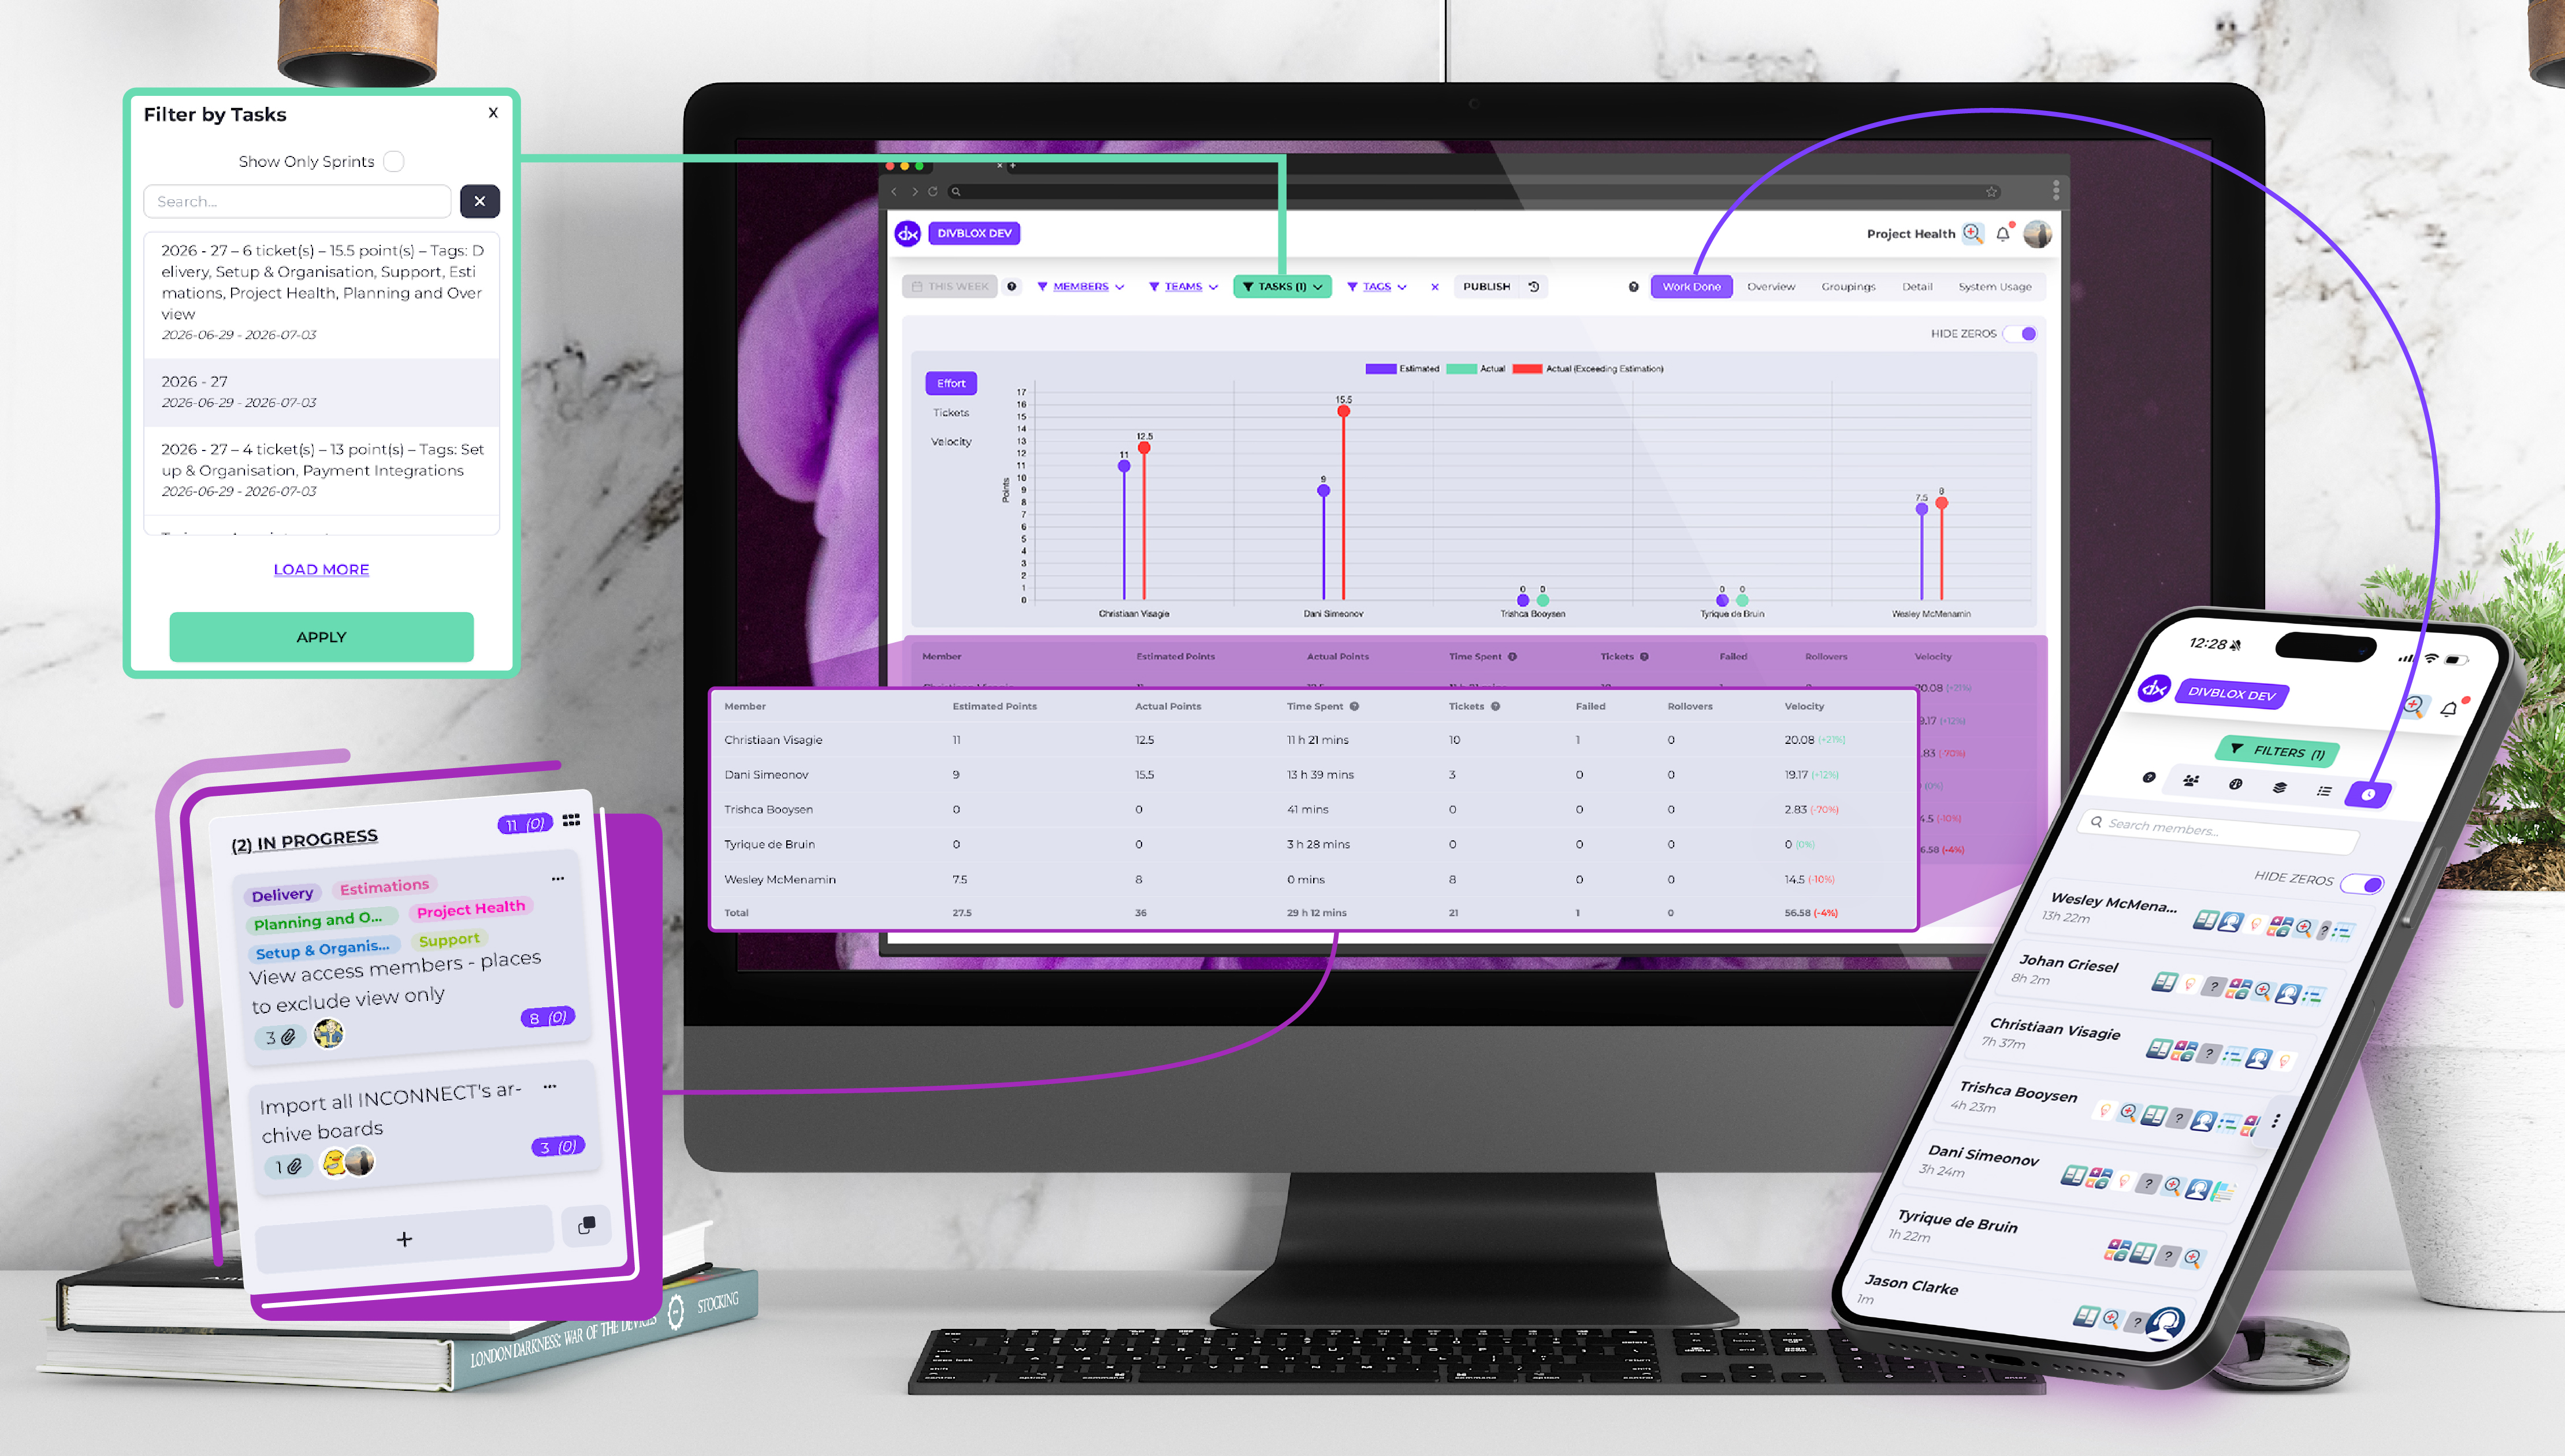
Finding the exact data point you need is simple. Project Health features robust filtering options, allowing you to slice and dice your engineering analytics by:
- Date Range (Perfect for reviewing specific quarters or historical sprints)
- List (Isolate specific workflow columns like Code Review or Released)
- Member(s) and Team (Compare velocity across various members)
- Task (See the health of specific high-level roadmap milestones)
Executive and Granular Reports
Project Health breaks down complex sprint data into high-level overviews and granular details, making it the perfect tool for engineering leads and stakeholders alike:
- Work Done Report: Provides a transparent look at the total effort expended and the exact time spent across your projects.
- Per-Member Breakdown: View individual contributions coupled with a dedicated burndown chart per developer. This helps identify who is overloaded and who has extra capacity.
- Overview Report: See a clean diagnostic of your pipeline, showing the number of active tickets and total effort points sorted by their current status list.
- Groupings Report: Track your operational focus by viewing the number of tickets and effort points sorted by customised tags (such as tech debt, bug fixes, or new features).
- Detail View: For those who want to review the raw data driving the metrics on a granular, ticket-by-ticket basis.
- System Usage: Shows exactly how much time team members spend inside the various Divblox apps. It provides clear visibility into workflow patterns, helping you see where your team is collaborating most effectively and where process bottlenecks might be slowing them down.
Data Portability and Smart Summaries
Data shouldn’t be locked inside a dashboard. Project Health provides easy extraction and automated summaries to save you time during stakeholder reviews:
- One-Click Exports: Need to run custom formulas or pull data into external BI tools? Instantly export your reports via CSV or JSON formats.
- AI-Powered Summaries: Instead of digging through charts before a retrospective, leverage the built-in AI integration. With one click, the AI analyses your current metrics and generates a concise, plain-text summary of your sprint’s performance, highlights, and blockers.
Turning Delivery into Predictability
By automating the collection of development data, Divblox effectively buries the traditional manual timesheet. Your work on the Kanban board is your metric tracking.
That wraps up our introductory series on the core Divblox ecosystem! From scoping requirements to auditing project health, your entire development workflow is now unified, transparent, and entirely predictable.
Thank you for following along! How does your team currently track sprint health and developer velocity?